The Shape of Money — How Transaction Graph Patterns Reveal What Rules Miss
Fraud does not always announce itself through a suspicious amount or a flagged account. Sometimes it announces itself through a shape.The same geometry — money converging, dispersing, cycling, routing through intermediaries — appears again and again across different schemes, different geographies, different networks. The shape is the signal.This article explains what those shapes are, why they matter, and how making them visible changes the investigation.
By Rachid CHIHANI Co-founder Thinsaction — March 2026 · 6 min read
A transaction can look ordinary when you see it alone. One sender pays one receiver. A second transfer follows. Then a third. Nothing seems dramatic. But once those links are placed inside agraph, the picture changes. What looked like unrelated activity can suddenly take the shape ofconcentration, dispersion, cycling, or coordinated routing.
That is why transaction graphs matter. They do not replace transaction-level analysis; they add themissing layer. They show how money moves as a structure. And in many cases, structure is wherethe real signal sits.
Recent work in graph analytics keeps returning to the same idea: the most useful signal is often nota single payment, but the shape formed by many payments together. The question is no longeronly whether one account looks unusual. It is whether a group of accounts forms a recognizable pattern.
Why graph structure changes the investigation
A graph is simply a way to represent accounts as nodes and transactions as directed links. That may sound technical, but the practical idea is straightforward: once transactions are connected, you can follow money across several steps instead of reading one line at a time.
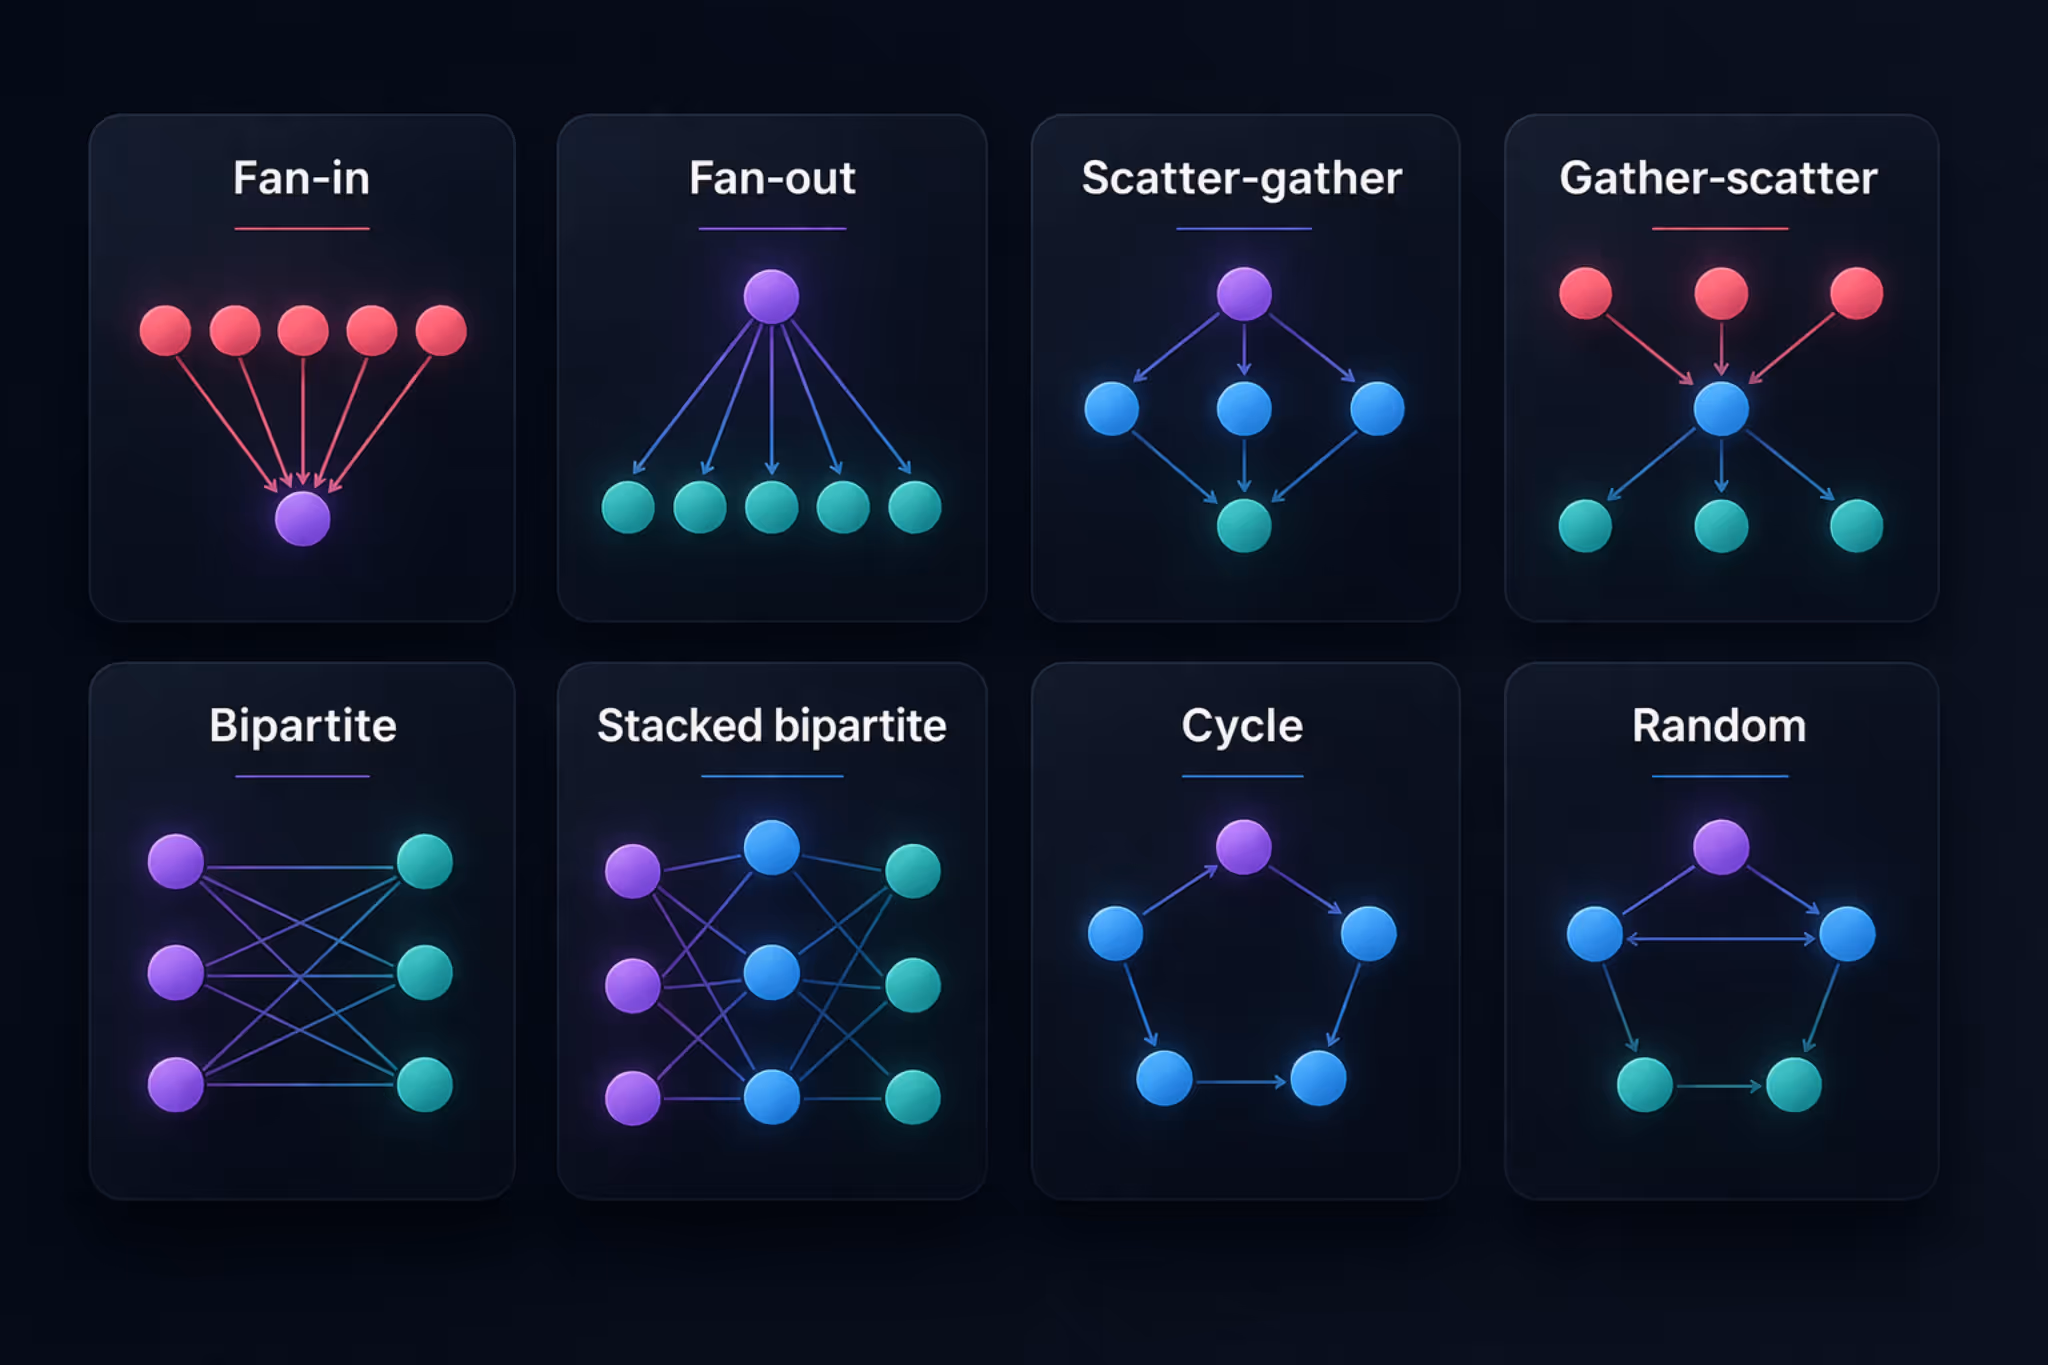
This matters because many recurring schemes are not defined only by amount or frequency. They are defined by shape. A fan-in pattern shows multiple sources feeding the same node. A fan-out pattern shows one node distributing funds to many destinations. Scatter-gather and gather-scatter patterns add an intermediate layer that makes the flow less obvious at first glance. Cycles and bipartite structures add another level of coordination.
Different papers sometimes use different labels for similar motifs. A fan-in may also be described as a collector pattern, while a fan-out may be described as a sink or distribution pattern. The names vary, but the underlying geometry stays familiar: many-to-one, one-to-many, many-to-many through an intermediary, or repeated loops.
Figure 1. Didactic view of recurring topological patterns in transaction graphs.
What these recurring patterns actually tell you
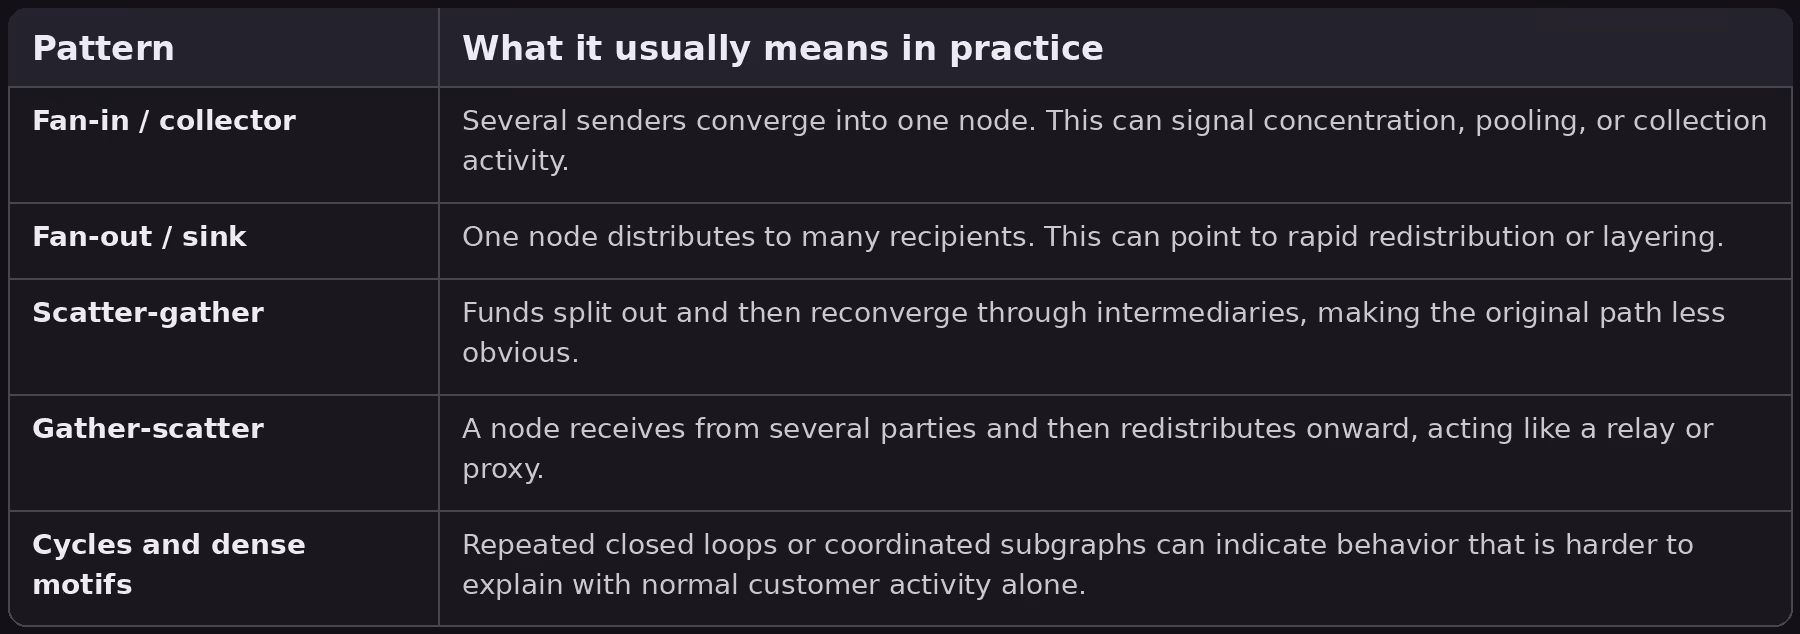
The value of these motifs is not only visual. Each one suggests a different operational question. A fan-in can point to concentration around a central account. A fan-out can point to distribution from a single source. A cycle can suggest value moving through a closed path instead of toward a final destination. A scatter-gather structure can suggest that funds are being broken apart and then recombined.
That is why graph reading changes the investigation. Instead of asking only who paid whom, you begin asking what role each node is playing in the wider flow. Is it collecting? Redistributing? Relaying? Closing a loop? Once the structure becomes visible, the case becomes easier to explain and easier to test.
This is also where graph analysis becomes more useful than a long alert list. An alert can tell you that something happened. A graph can show whether the same shape is appearing again and again across time windows, customers, or geographies.
Why these patterns are difficult to catch in real life
The challenge is not only to define the right pattern. It is also to find it reliably inside a large, sparse, and constantly changing network. Real transaction graphs contain huge numbers of legitimate accounts, many short-lived relationships, and a small number of very active hubs. That makes pattern detection both a data problem and an interpretation problem.
Three difficulties come up again and again. The first is scale: checking every possible subgraph quickly becomes expensive. The second is timing: a pattern that matters over three days may disappear when you look at a full year all at once. The third is explainability: even when a model finds something important, investigators still need to understand why the pattern was flagged.
This is why graph workflows usually combine structure with context. Time windows, transaction direction, account roles, and neighborhood analysis all help separate a real recurring motif from a shape that is merely accidental.
From raw transactions to readable graph signals
A practical workflow usually follows a simple sequence. First, transactions are turned into a directed graph. Then the graph is broken into manageable windows so evolving behavior does not disappear inside one giant static network. After that, local communities or suspicious neighborhoods are isolated. Finally, those structures are compared with recurring motifs or scored with graph-based models.
That sequence matters because it mirrors how investigators work. They do not need an abstract graph for its own sake. They need a way to move from raw transaction data to a small number of readable structures that deserve attention.
In that sense, graph detection does not replace rules. It strengthens them. A threshold crossing becomes much more informative when it sits inside a recognizable structure.
From graph structure to investigative signal
The right approach does not stop at listing suspicious transactions. It makes the network shape visible — surfacing recurring topological patterns, showing the nodes involved, distinguishing first-degree participants from the core node, and presenting the event flow as a structure investigators can actually read.
In practice, that means a fan-in no longer appears as a long list of incoming payments. It appears as a concentration pattern. A fan-out becomes an observable distribution hub. A cycle stops being a sequence of disconnected transfers and becomes a closed structure. Once the pattern is visible, it becomes easier to ask the right questions: is this node acting as a collector, is this relay behaving like a proxy, is the same shape reappearing across customers or time windows?
Some detections are simple and didactic, such as fan-in or one-to-many structures. Others are larger and more layered, with central nodes, rings of counterparties, and mixed directional flows. That range matters because real investigations rarely stay inside one textbook pattern. They move from simple motifs to combined structures.
Sources consulted:
Zola, F., Medina, J. A., Venturi, A., Gil, A., & Orduna, R. (2025). A Graph Machine Learning Approach for Detecting Topological Patterns in Transactional Graphs. arXiv preprint arXiv:2509.12730
Rakhmetulayeva, S., Kulbayeva, A., Bolshibayeva, A., & Serbin, V. (2025). Identifying the graph based typology features for machine learning models in financial fraud detection. Eastern-European Journal of Enterprise Technologies, 135(9)
Starnini, M., Tsourakakis, C. E., Zamanipour, M., Panisson, A., Allasia, W., Fornasiero, M., ... & Moncalvo, D. (2021, September). Smurf-based anti-money laundering in time-evolving transaction networks. In Joint European Conference on Machine Learning and Knowledge Discovery in Databases (pp. 171-186). Cham: Springer International Publishing