The Money Trail That Never Stops: Understanding Daisy Chains in Payment Networks
Here is the intuition: a daisy chain is not about one payment that looks extreme. It is about value being passed along a line of accounts so that each local step appears ordinary, while the full path tells a very different story.
By Rachid CHIHANI Co-founder — Thinsaction — April 2026 · 9 min read
Most monitoring systems are very good at spotting single events: a large transfer, a sudden spike, an unusual destination, a customer who moves much faster than before. Daisy chains are different. Their signal is structural. What matters is not one transaction, but the sequence.
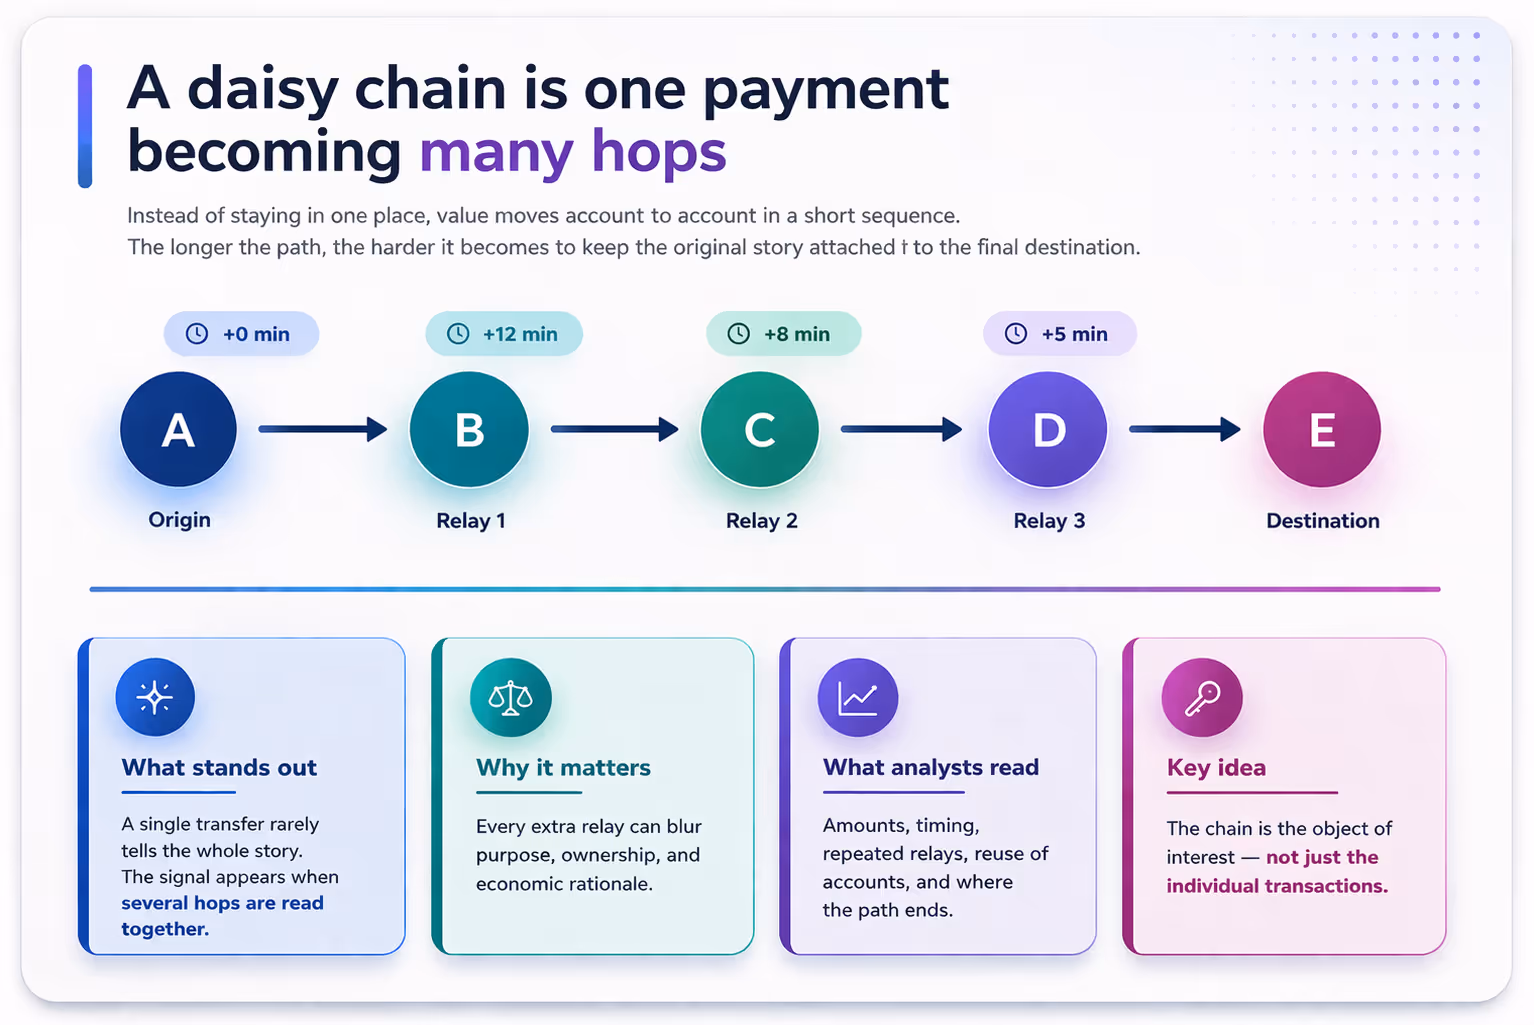
Imagine money leaving one account, landing briefly in another, moving again, then again, then again. Each relay may have a simple explanation on its own. But when the path is read end to end, the movement starts to look less like a business process and more like a forwarding mechanism.
Figure 1. A daisy chain is a path problem: the signal comes from the sequence, the speed, and the fact that intermediaries behave like relays.
Start with the picture, not the jargon
A good way to understand the pattern is to forget technical vocabulary for a moment. Ask one simple question instead: does the money stop where economic value is created, or does it keep moving through entities that do little more than pass it onward?
That question is powerful because legitimate payment chains do exist. Treasury operations, payment service providers, marketplaces, and settlement flows can all create multi-step paths. The concern begins when the chain becomes too fast, too repetitive, too circular in logic, or too thin in commercial substance.
What exactly makes a daisy chain interesting?
Looks ordinary up close
Looks different end to end
One account pays another
Amounts may stay within normal ranges
Each step may have a local explanation
No single hop is dramatic
Many short hops in sequence
Similar amounts survive across relays
Intermediaries add little visible economic value
The path repeats across customers, days, or corridors
In other words, the pattern becomes meaningful when operations are viewed as a graph and as a timeline at the same time.
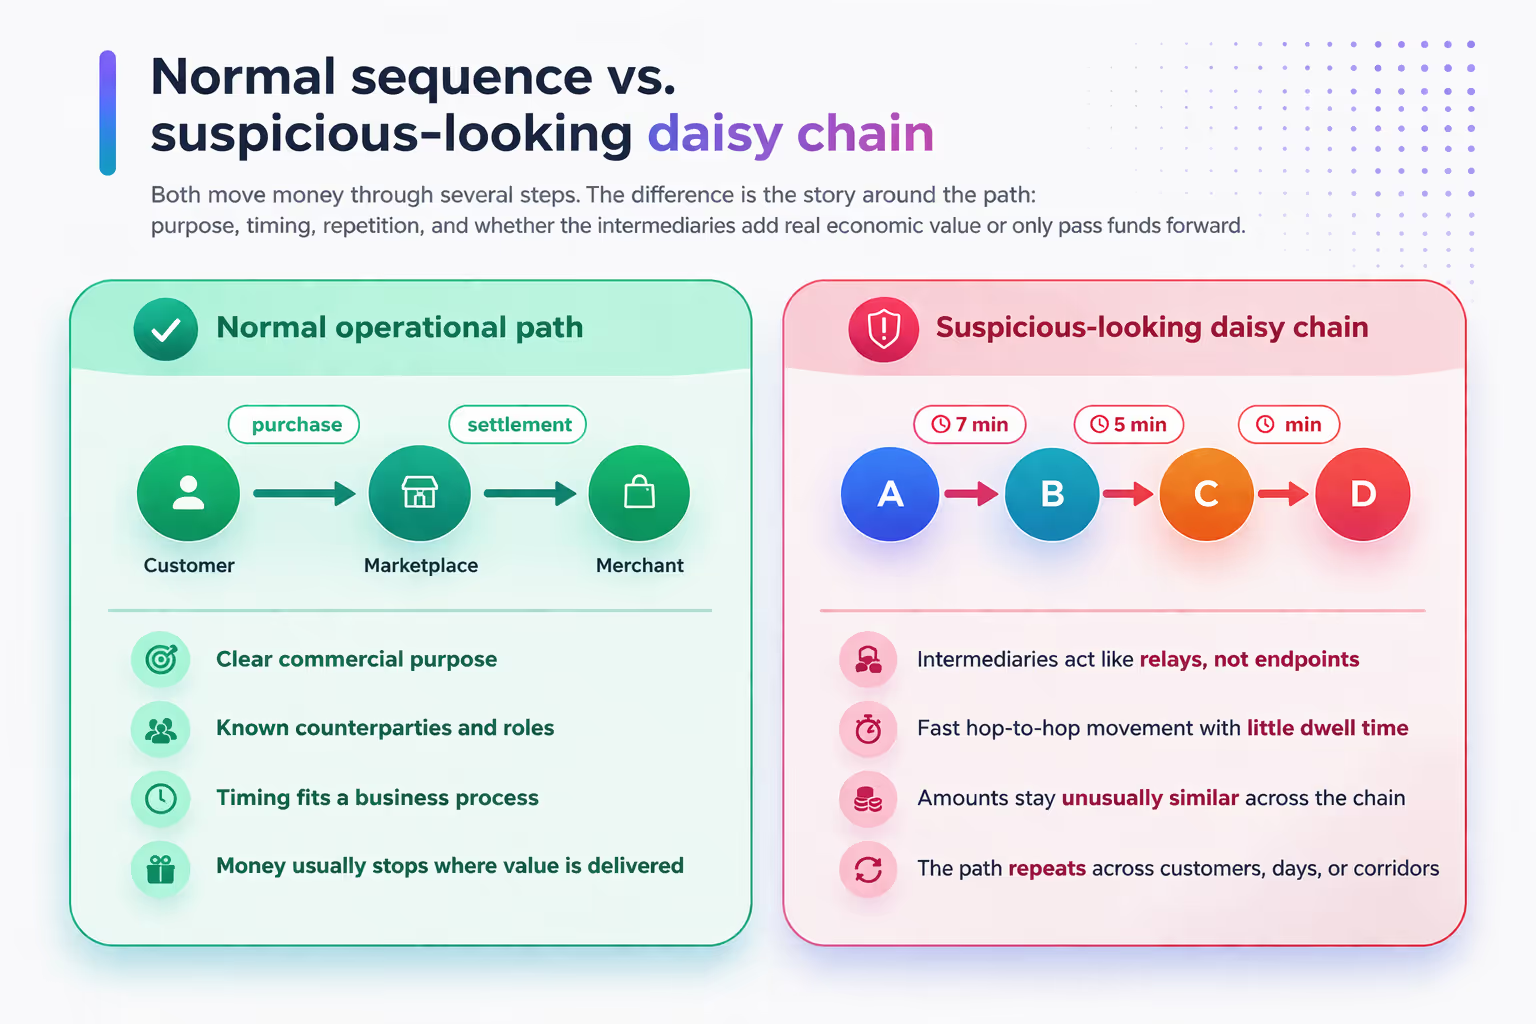
Figure 2. A normal multi-step payment path and a suspicious-looking daisy chain can both have several hops. The difference is in the purpose, speed, repetition, and usefulness of the intermediaries.
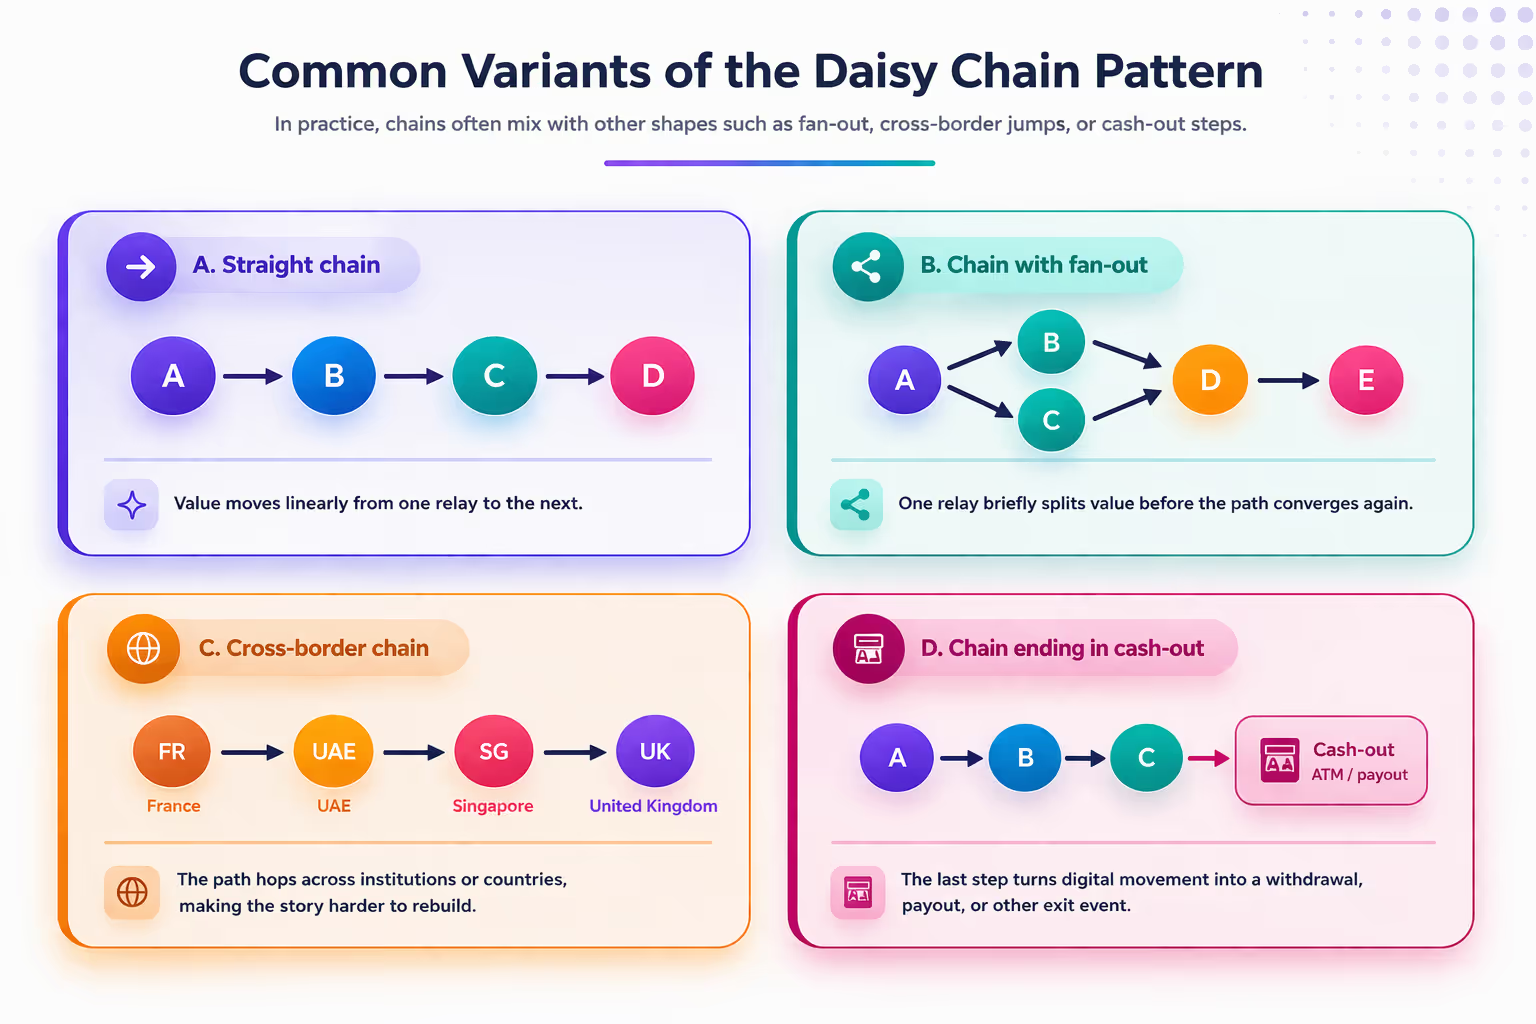
This figure shows that the daisy chain is not one rigid shape but a family of related transaction paths. In its simplest form, value moves step by step from one relay account to the next. In more complex variants, the path briefly splits and reconnects, crosses borders or institutions, or ends in a cash-out event. What makes these variants important is that each extra hop, split, or jurisdiction change can reduce visibility into the original source and the final destination of funds.
Figure 3. Common variants of the daisy chain pattern: straight chain, chain with fan-out, cross-border chain, and chain ending in cash-out.
This figure extends the main idea by showing that daisy chains rarely appear in only one form. Some paths are linear, others briefly split before converging again, some move across borders, and others end in a payout or withdrawal. The common signal is the relay logic: value keeps moving through intermediate steps that make the original source and final destination harder to connect.
Read the chain as a story
Analysts rarely treat a daisy chain as a geometric line only. They read it as a story with roles. Who starts the movement? Which accounts only relay? Where does the chain pause? Does the path end in cash withdrawal, a high-risk destination, a known exchange point, or a beneficiary that appears again and again?
This is why the same pattern can carry very different meaning depending on context. A chain across known operational entities may be routine. A chain built from newly active accounts, short dwell times, and repeated amount continuity may deserve much closer attention.
Signals that often strengthen the case
• Very short delay from one hop to the next
• Amounts that remain almost unchanged across the path
• Relay accounts that repeatedly receive and send rather than hold
• Multiple chains converging on the same endpoint
• The same path pattern appearing again with different customers or dates
How institutions usually rebuild the trail
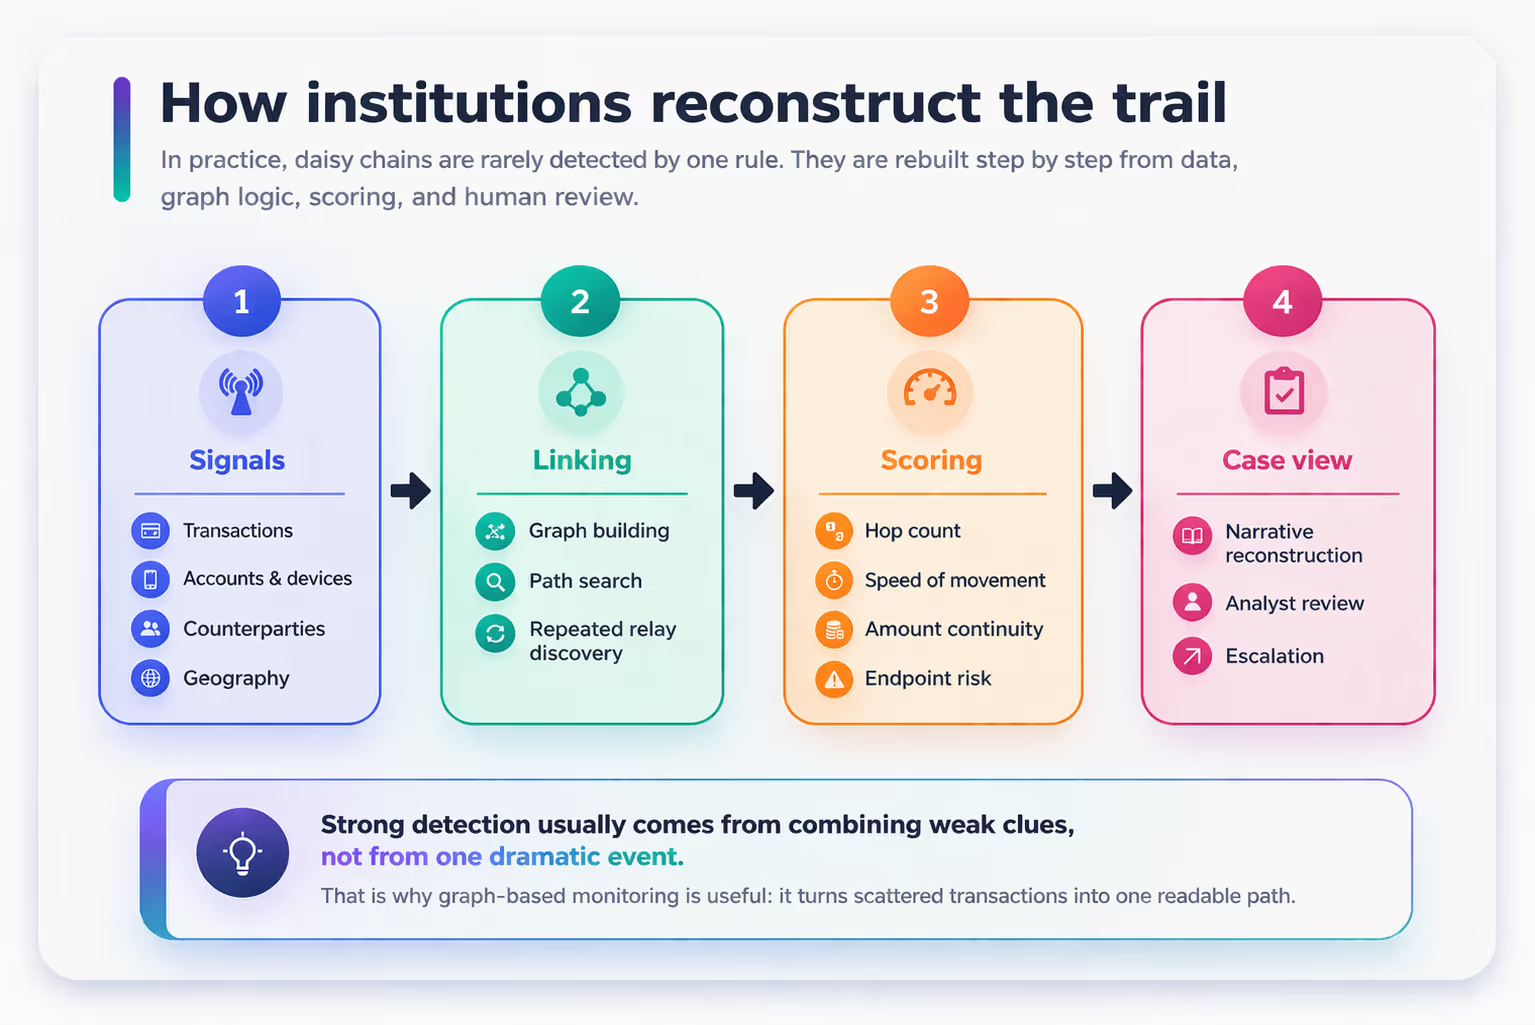
Modern institutions typically do not rely on one threshold to find a chain. They combine several layers. First comes linking: transactions are turned into a network of accounts, beneficiaries, devices, products, times, and sometimes geographic corridors. Then comes path search: systems look for short relay structures, amount continuity, repeated endpoints, and abnormal speed.
After that comes scoring. A chain becomes more interesting when several weak clues point in the same direction. Finally, human analysts review the path, check whether the intermediaries have a real role, compare the chain with expected operating behavior, and decide whether the sequence deserves escalation.
Figure 4. In practice, daisy chains are reconstructed from many pieces: data linking, graph analysis, scoring, and analyst review.
What today’s research says
The state of the art has moved away from looking only at isolated transactions. A first wave of work used rules, expert scenarios, and classic data mining to identify suspicious sequences and groups. A second wave treated payment activity as a graph, allowing researchers to detect patterns such as cycles, fan-in, fan-out, gather-scatter structures, and relay chains more naturally.
More recent work brings in graph neural networks, temporal graph models, motif analysis, explainability, and synthetic benchmark data. The common direction is clear: suspicious activity is easier to detect when institutions model relationships, order of events, and repeated structures together rather than one transaction at a time.
Older line of work
What changed
What is new now
Why it matters
Rules, expert scenarios, clustering, and graph mining to spot suspicious structures.
Graph representations made paths and communities easier to analyze.
Temporal graphs, GNNs, synthetic data, explainability, and collaborative analytics.
Daisy chains are relational and sequential. Newer methods are better aligned with that reality.
A practical analyst mindset
A useful way to think about daisy chains is this: do not ask only “Is this transaction unusual?” Also ask “Does this account seem to exist mainly to move value to the next stop?” That small change in perspective often reveals patterns that event-based monitoring misses.
Put simply, suspicious daisy chains are not loud. They are often tidy, fast, and operational-looking. Their power comes from sequence, not spectacle.
References
Akoglu, L., Tong, H., & Koutra, D. (2015). Graph-based anomaly detection and description: A survey. Data Mining and Knowledge Discovery, 29, 626–688.
Altman, E., et al. (2023). Realistic synthetic financial transactions for anti-money laundering models. NeurIPS Datasets and Benchmarks.
Bakhshinejad, N., et al. (2024). A graph-based deep learning model for anti-money laundering. ICAART 2024.
Bershtein, L. S., et al. (2013). A clique-based method for mining fuzzy graph patterns in suspicious money transfer activities. ACM SAC.
Blanusa, J., et al. (2024). Graph Feature Preprocessor: Real-time subgraph-based feature extraction for financial crime detection. OpenReview preprint.
Cheng, D., Zou, Y., Xiang, S., & Jiang, C. (2024/2025). Graph neural networks for financial fraud detection: A review. Frontiers of Computer Science.
Demetis, D. S. (2018). Fighting money laundering with technology: A case study of Bank X in the UK. Information & Management, 55(3), 315–326.
Dreżewski, R., Dziuban, G., Hernik, L., & Paczek, M. (2015). Comparison of data mining techniques for money laundering detection system. 2015 International Conference on Information & Communication Technology and Systems.
Egressy, B., et al. (2024). Provably powerful graph neural networks for directed multigraphs. AAAI 2024.
Jensen, R., & Iosifidis, A. (2022). Fighting money laundering with statistics and machine learning. Wiley Interdisciplinary Reviews: Data Mining and Knowledge Discovery.
Kim, Y., et al. (2024). Temporal Graph Networks for graph anomaly detection in financial transactions. arXiv preprint arXiv:2404.00060.
Kute, D. V., et al. (2022). Explainable deep learning approach for detecting money laundering: A literature review. University of Technology Sydney thesis/review.
Lin, J., et al. (2024). FraudGT: A simple, effective, and efficient graph transformer for fraud detection. KDD 2024.
Lopez-Rojas, E. A., & Axelsson, S. (2012). Money laundering detection using synthetic data. Nordic Conference on Secure IT Systems (NordSec).
Michalak, K., & Korczak, J. (2011). Graph mining approach to suspicious transaction detection. Federated Conference on Computer Science and Information Systems.
Motie, S., et al. (2024). Financial fraud detection using graph neural networks. Expert Systems with Applications.
Oztas, B., et al. (2023). Development of a synthetic transaction monitoring dataset. IEEE Conference paper.
Savage, D., Wang, Q., Chou, P., Zhang, X., & Yu, X. (2016/2017). Detection of money laundering groups using supervised learning in networks. arXiv / AAAI Workshop on Artificial Intelligence for Cyber Security.
Schmidt, J., et al. (2024). GAMLNet: A graph-based framework for the detection of money laundering patterns. Workshop/preprint.
Usman, A., et al. (2023). Intelligent anti-money laundering fraud control using graph-based machine learning. Journal of Big Data / related publication.
Visser, F. (2019). Detection of money laundering transaction network structures and typologies using machine learning techniques. Erasmus University thesis.
Weber, M., Chen, J., Suzumura, T., et al. (2018). Scalable graph learning for anti-money laundering: A first look. arXiv:1812.00076.
Weber, M., Domeniconi, G., Chen, J., et al. (2019). Anti-money laundering in Bitcoin: Experimenting with graph convolutional networks for financial forensics. KDD Workshop / arXiv:1908.02591.
Wang, Q., et al. (2025). Temporal transaction network anomaly detection for distributed financial data. Information Sciences.
Xu, H., et al. (2024). Intelligent anti-money laundering transaction pattern recognition system based on graph neural networks. TechRxiv preprint.